Component technology in an embedded system
Master's thesis in computer science
Master's thesis in computer science
Execution tracing allows developers and administrators to monitor the runtime behavior of programs. Some tracing facilities monitor some or all of the actions taken by the program for a limited time, while others allow developers to directly or indirectly insert tracepoints into the program code. When encountered at runtime, they collect information for later perusal or let the user know that the tracepoint has been encountered (say, by writing to a file or to standard output). Tracing is notably different from debugging, where breakpoints stop the execution of the program.
There are many examples of trace facilities in industry. In their simplest form, developers manually add “print statements” to their programs, often at the start and end of functions or methods.1 The ltrace and strace programs, that are often part of Linux distributions, print information to standard output when the instrumented program calls functions in shared libraries and invokes system calls, respectively. For embedded systems, in-circuit debuggers can often generate precise traces of all activity of an embedded processor, which coupled with metadata emitted by the linker can yield insights into the system behavior. Emulators, such as QEMU, often have facilities to generate traces, which they can easily do as they have complete control of the execution environment.
A prominent tracing facility in industry is DTrace, by Sun Microsystems. It allows developers to run scripts that collect data when tracepoints are encountered, and supports both kernel-mode and user-mode tracing. DTrace tracepoints can be enabled and disabled at runtime. Most disabled tracepoints have no performance cost, which DTrace realizes by rewriting code at runtime in much the same way as described in section 7.1. Scripts are designed to be safe to run even in a production system, and are therefore written for a “safe” virtual machine. An example of this safety property is that the instruction set of the virtual machine only allows forward jumps, making constructs such as non-terminating loops (and indeed any loops) impossible to express (Cantrill et al. 2004).
A simple execution tracing facility for ECMX objects, realized using code interception, has been implemented as part of this thesis work. Developers select the classes whose objects should be traced before building the product, and can easily select all classes that belong to a particular module, all classes whose names match a certain pattern, or even all classes present in the system.
The instantiation and destruction of objects, as well as all occurrences of code entering and leaving their operation bodies, are written to a human-readable trace file that if possible resides on an external memory card (meaning that its size is only limited to the capacity of the memory card). Entries in the trace file include a timestamp and the name of the class, and for entries that record code entering or leaving operations, the name of the interface and operation. Crucially for debugging calls involving multiple processes, entries also include the process identifier of the currently running process. Operations belonging to proxies are specially identified, and such entries also include the process identifier of the process on the receiving end.
C98487__2c434f7434124CJPEGImageFactory__
E98487__2c434f7434200CJPEGImageFactory_IUIImageFileFactory_CreateImage
C98487__2c56cc7c34264CJPEGImage__
L98487__2c434f7434404CJPEGImageFactory_IUIImageFileFactory_CreateImage
D98487__2c434f7434436CJPEGImageFactory__
E98487__2c56cc7c34484CJPEGImage_IUIImage_GetDimensions
L98487__2c56cc7c34528CJPEGImage_IUIImage_GetDimensions
E98487__2c56cc7c34576CJPEGImage_IUIImageJPEGSettings_HasThumbnail
L98487__2c56cc7c34668CJPEGImage_IUIImageJPEGSettings_HasThumbnail
Listing 7.1 contains a heavily abridged version of a trace file captured at Sony Ericsson. Entries in the trace file, which correspond to lines, are recognized by a finite automaton that corresponds to the following regular expression (Perl syntax):
The first character identifies the type of the entry. C indicates that a class has been instantiated and D that an object has been destroyed. E signifies that an operation body has been entered and L that one has been left. P denotes that the body of a synchronous operation that is part of a client-side proxy has been entered and A likewise for the body of an asynchronous operation. Finally, S signifies that the body of an operation belonging to a server-side proxy has been entered (a “stub,” in Sony Ericsson parlance).
The number that follows is the process identifier of the currently running process. Entries that reflect proxy operations (identified by P, A or S) next include the process identifier of the receiving process (this part is blank for the other entry types). The hexadecimal number that follows uniquely identifies the object that the entry refers to, and is followed by a timestamp.2 The next string is the compile-time name of the class. The two remaining strings are blank for entries that reflect object instantiation or destruction, but are otherwise the compile-time name of the interface that the called operation belongs to, followed by the name of the called operation.
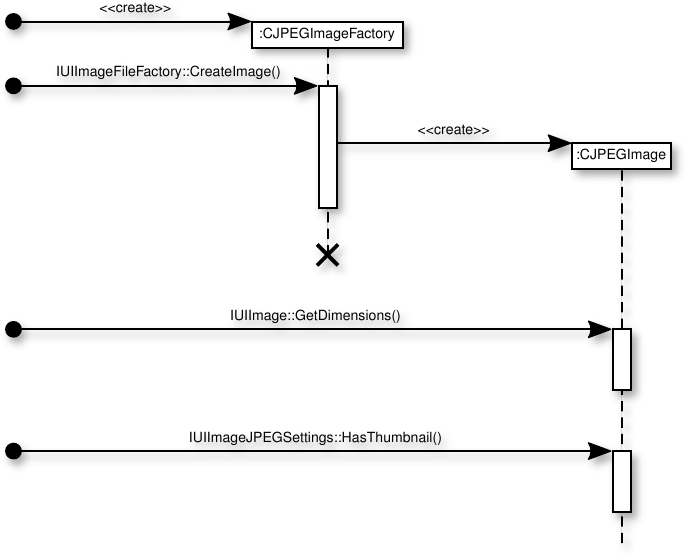
Also as part of this thesis work, a tool has been written that infers a UML interaction sequence diagram from a trace file. Figure 7.1 shows the (lightly edited) sequence diagram generated from the trace file of Listing 7.1.3
This tracing facility is useful for debugging all object interactions, but especially those that cross process boundaries. Entries for proxy operations include the process identifiers of both the sending and receiving processes, making it possible to identify process deadlocks.
COM+ provides a service that corresponds to this tracing facility in the form of COM+ Instrumentation. This service publishes events to clients using a loosely-coupled event service. Clients can subscribe to a wide variety of different events, including notifications related to security, transactions, exceptions and object pools, and notably also object instantiation and destruction, as well as when operations are entered and exited.
The trace feature developed as part of this thesis work has been integrated into Sony Ericsson’s main codebase, and is available to all developers. The proxy-related entry types were implemented by Sony Ericsson after the commencement of this thesis work.
Footnotes